上一节学习了如何部署 Prometheus Server,这节学习如何使用 Exporter 收集主机数据。在 Prometheus 的架构设计中,Prometheus Server 并不直接服务监控特定的目标,其主要任务负责数据的收集,存储并且对外提供数据查询支持。因此为了能够能够监控到某些东西,如主机的CPU使用率,需要使用到 Exporter。Prometheus 周期性的从 Exporter 暴露的 HTTP 服务地址(通常是 /metrics)拉取监控样本数据。
Exporter 是一个相对开放的概念,可以是一个独立运行的程序独立于监控目标,也可以直接内置在监控目标中。只要能够向 Prometheus 提供标准格式的监控样本数据即可
Exporter 概念#
广义上所有可以向 Prometheus 提供监控样本数据的程序都可以被称为一个 Exporter 。Exporter 的一个实例称为Target,Prometheus 通过轮询的方式定期从这些 Target 中获取样本数据。

Exporter 来源#
社区提供#
Prometheus 社区提供了丰富的 Exporter 实现,涵盖了从基础设施,中间件以及网络等各个方面的监控功能。这些Exporter 可以实现大部分通用的监控需求。下面表格列举了社区中常用的 Exporter:
| 范围 | 常用Exporter |
|---|---|
| 数据库 | MySQL Exporter, Redis Exporter, MongoDB Exporter, MSSQL Exporter等 |
| 硬件 | Apcupsd Exporter,IoT Edison Exporter, IPMI Exporter, Node Exporter等 |
| 消息队列 | Beanstalkd Exporter, Kafka Exporter, NSQ Exporter, RabbitMQ Exporter等 |
| 存储 | Ceph Exporter, Gluster Exporter, HDFS Exporter, ScaleIO Exporter等 |
| HTTP服务 | Apache Exporter, HAProxy Exporter, Nginx Exporter等 |
| API服务 | AWS ECS Exporter, Docker Cloud Exporter, Docker Hub Exporter, GitHub Exporter等 |
| 日志 | Fluentd Exporter, Grok Exporter等 |
| 监控系统 | Collectd Exporter, Graphite Exporter, InfluxDB Exporter, Nagios Exporter, SNMP Exporter等 |
| 其它 | Blockbox Exporter, JIRA Exporter, Jenkins Exporter, Confluence Exporter等 |
自定义创建#
除了直接使用社区提供的 Exporter 程序以外,还可以基于 Prometheus 提供的 Client Library 创建自己的 Exporter 程序。目前 Promthues 社区官方提供了对以下编程语言的支持:Go、Java/Scala、Python、Ruby。同时还有第三方实现的如:Bash、C++、Common Lisp、Erlang,、Haskeel、Lua、Node.js、PHP、Rust 等。
Exporter 运行方式#
独立使用#
以 Node Exporter 为例,由于操作系统本身并不直接支持 Prometheus 同时用户也无法通过直接从操作系统层面上提供对 Prometheus 的支持。因此只能通过独立运行一个程序的方式,通过操作系统提供的相关接口,将系统的运行状态数据转换为可供 Prometheus 读取的监控数据。 除了 Node Exporter 以外,比如 MySQL Exporter、Redis Exporter 等都是通过这种方式实现。 在这里 Exporter 程序扮演了中间代理人的角色。
应用中集成#
为了能够更好的监控系统的内部运行状态,有些开源项目如 Kubernetes,ETCD 等直接在代码中使用了Prometheus 的 Client Library,提供了对 Prometheus 的直接支持。这种方式让应用程序可以直接将内部的运行状态暴露给 Prometheus,适合于需要更多自定义监控指标需求的项目。
Exporter 规范#
所有的 Exporter 程序都需要按照 Prometheus 的规范,返回监控的样本数据。以 Node Exporter 为例,当访问 /metrics 地址时会返回以下内容:
# HELP node_cpu Seconds the cpus spent in each mode.
# TYPE node_cpu counter
node_cpu{cpu="cpu0",mode="idle"} 362812.7890625
# HELP node_load1 1m load average.
# TYPE node_load1 gauge
node_load1 3.0703125
这是一种基于文本的格式规范,相比于 Protocol buffer 文本具有更好的可读性,以及跨平台性。
Prometheus 2.0 之前的版本支持 Protocol buffer 规范,2.0 及之后的版本不再支持 Protocol buffer
Exporter 返回的样本数据,主要由三个部分组成:样本一般由 注释信息(HELP),样本的类型注释信息(TYPE)和 样本组成。Prometheus 会对 Exporter 响应的内容逐行解析:
- 如果当前行以
# HELP开始,Prometheus 将按照以下规则对内容进行解析,得到当前指标名称以及相应的说明信息
# HELP <metrics_name> <doc_string>- 如果当前行以
# TYPE开始,Prometheus 将按照以下规则对内容进行解析,得到当前指标名称以及指标类型
# TYPE <metrics_name> <metrics_type>TYPE 注释行必须出现在指标的第一个样本之前。如果没有明确指标类型需要返回为 untyped 。 除了 # 开头的所有行都会被视为是监控样本数据。 每一行样本需要满足以下格式规范:
metric_name [{label_name="label_value"} ] value [ timestamp ]

# 示例
node_cpu_seconds_total{cpu="1",mode="system"} 2.2
其中 metric_name 和 label_name 必须遵循 PromQL 的格式规范要求。value 是一个 float 格式的数据,timestamp 类型为 int64(从1970-01-01 00:00:00以来的毫秒数),timestamp 可选,默认为当前时间。具有相同metric_name 的样本必须按照一个组的形式排列,并且每一行必须是唯一的指标名称和标签键值对组合。
需要注意:对于 istogram 和 summary 类型的样本。按照以下约定返回样本数据:
- 类型为 summary 或 histogram 的指标 x,该指标所有样本值的总和需要使用一个单独的 x_sum 指标表示
- 类型为 summary 或 histogram 的指标 x,该指标所有样本的总数需要使用一个单独的 x_count 指标表示
- 类型为 summary 的指标 x,其不同分位数 quantile 所代表的样本,需要使用单独的
x{quantile="y"}表示- 类型 histogram 的指标 x,为了表示其样本的分布情况,每一个分布需要使用
x_bucket{le="y"}表示,其中y为当前分布的上位数。同时必须包含一个样本x_bucket{le="+Inf"},并且其样本值必须和x_count相同- 对于 histogram 和 summary 的样本,必须按照分位数
quantile和分布le的值的递增顺序排序
以下是类型为 histogram 和 summary 的样本输出示例:
# A histogram, which has a pretty complex representation in the text format:
# HELP http_request_duration_seconds A histogram of the request duration.
# TYPE http_request_duration_seconds histogram
http_request_duration_seconds_bucket{le="0.05"} 24054
http_request_duration_seconds_bucket{le="0.1"} 33444
http_request_duration_seconds_bucket{le="0.2"} 100392
http_request_duration_seconds_bucket{le="+Inf"} 144320
http_request_duration_seconds_sum 53423
http_request_duration_seconds_count 144320

# Finally a summary, which has a complex representation, too:
# HELP rpc_duration_seconds A summary of the RPC duration in seconds.
# TYPE rpc_duration_seconds summary
rpc_duration_seconds{quantile="0.01"} 3102
rpc_duration_seconds{quantile="0.05"} 3272
rpc_duration_seconds{quantile="0.5"} 4773
rpc_duration_seconds_sum 1.7560473e+07
rpc_duration_seconds_count 2693
对于 Prometheus 还没有提供支持的编程语言,只需要按照以上规范返回响应的文本数据即可。
指定样本格式#
在 Exporter 响应的 HTTP 头信息中,可以通过 Content-Type 指定特定的规范版本,例如:
HTTP/1.1 200 OK
Content-Encoding: gzip
Content-Length: 2906
Content-Type: text/plain; version=0.0.4
Date: Sat, 17 Mar 2018 08:47:06 GMT
其中 version 用于指定 Text-based 的格式版本,当没有指定版本的时候,默认使用最新格式规范的版本。同时 HTTP 响应头还需要指定压缩格式为 gzip。
常用 Exporter#
Node Exporter#
为了能够采集到主机的运行指标如:CPU、内存、磁盘等信息,需要在主机上安装一个 Node Exporter 程序,该程序对外暴露了一个用于获取当前监控样本数据的 HTTP 访问地址。这样的程序称为 Exporter,Exporter 的实例称为一个 Target。Prometheus 通过轮询的方式定时从这些 Target 中获取监控数据样本。
安装#
Node Exporter 同样采用 Golang 编写,并且不存在任何的第三方依赖,只需要下载,解压即可运行。可以从 https://prometheus.io/download/ 获取最新的 Node Exporter 版本的二进制包。
在 usr 目录下创建 exporter 目录:
[root@wangpengliang101ecs ~]# cd /usr/
[root@wangpengliang101ecs usr]# ls
bin  etc  games  include  lib  lib64  libexec  local  sbin  share  src  tmp
[root@wangpengliang101ecs usr]# mkdir exporter
[root@wangpengliang101ecs usr]# cd exporter
下载 Node Exporter.tar.gz 并解压到当前目录:
curl -LO https://github.com/prometheus/node_exporter/releases/download/v1.3.1/node_exporter-1.3.1.linux-amd64.tar.gz

[root@wangpengliang101ecs exporter]# tar -xzf node_exporter-1.3.1.linux-amd64.tar.gz
[root@wangpengliang101ecs exporter]# ls
node_exporter-1.3.1.linux-amd64  node_exporter-1.3.1.linux-amd64.tar.gz
运行 node exporter
[root@wangpengliang101ecs exporter]# cd node_exporter-1.3.1.linux-amd64/
nohup ./node_exporter & # 后台运行,端口默认9100
这里使用
nohup后台运行 node_exporter,默认端口为9100,如果端口有冲突可以通过--web.listen-address=:xxx进行修改
启动成功后,查看端口
[root@wangpengliang101ecs node_exporter-1.3.1.linux-amd64]# netstat -anplt|grep 9100
tcp6       0      0 :::9100                 :::*                    LISTEN     2443/./node_exporte
tcp6 0 0 172.17.135.171:9100 222.174.189.42:52597 ESTABLISHED 2443/./node_exporte监控指标#
访问 http://ipaddress:9100/metrics ,可以看到当前 node exporter 获取到的主机监控数据,如下所示:
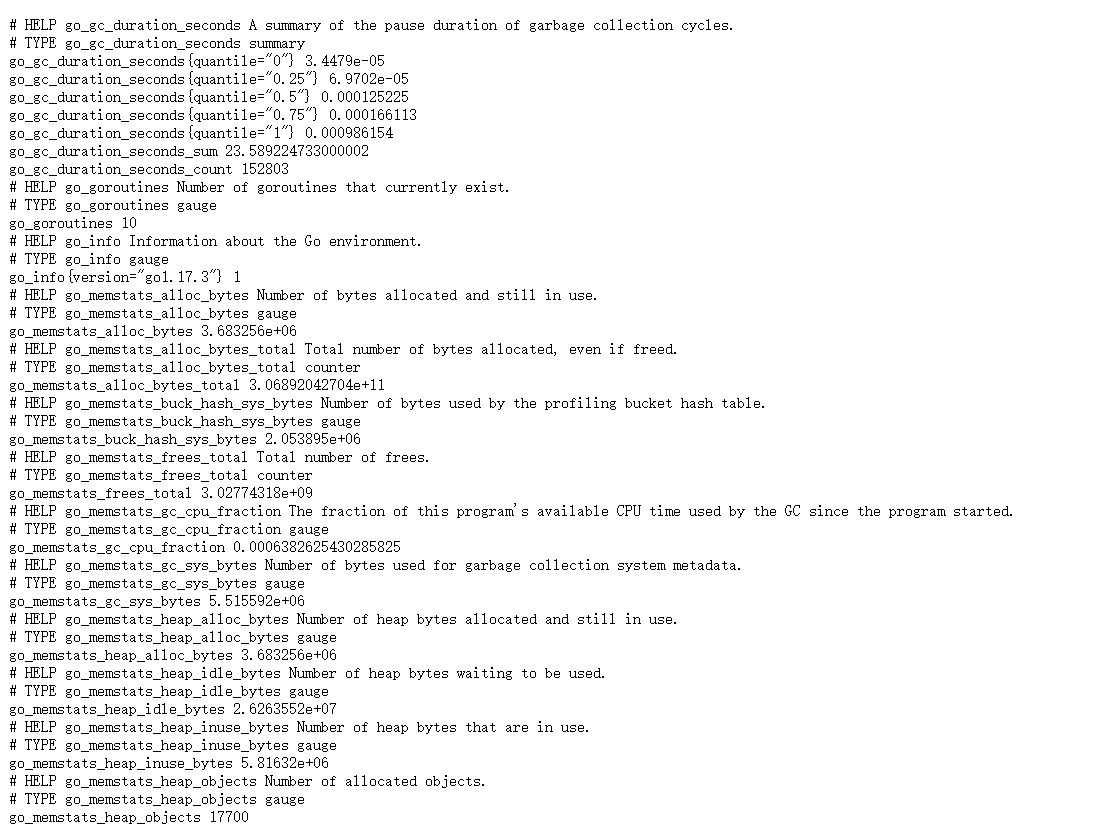
每一个监控指标之前都会有一段类似于如下形式的信息:
# HELP node_cpu Seconds the cpus spent in each mode.
# TYPE node_cpu counter
node_cpu{cpu="cpu0",mode="idle"} 362812.7890625

# HELP node_load1 1m load average.
# TYPE node_load1 gauge
node_load1 3.0703125
其中 HELP 用于解释当前指标的含义,TYPE 则说明当前指标的数据类型。在上面的例子中:
- node_cpu 的注释表明当前指标是 cpu0 上 idle 进程占用CPU的总时间,CPU占用时间是一个只增不减的度量指标,从类型中也可以看出node_cpu的数据类型是计数器(counter),与该指标的实际含义一致
- node_load1 该指标反映了当前主机在最近一分钟以内的负载情况,系统的负载情况会随系统资源的使用而变化,因此 node_load1 反映的是当前状态,数据可能增加也可能减少,从注释中可以看出当前指标类型为仪表盘(gauge),与指标反映的实际含义一致
除了这些以外,根据物理主机系统的不同,还可能看到如下监控指标:
node_boot_time:系统启动时间node_cpu:系统CPU使用量nodedisk:磁盘IOnodefilesystem:文件系统用量node_load1:系统负载nodememeory:内存使用量nodenetwork:网络带宽node_time:当前系统时间go_*:node exporter中go相关指标process_*:node exporter自身进程相关运行指标
集成#
为了能够让 Prometheus Server 能够从当前 Node Exporter 获取到监控数据,需要修改 Prometheus 配置文件。编辑 prometheus.yml 在 scrape_configs 节点下添加以下内容:
scrape_configs:
- job_name: 'prometheus'
static_configs:
- targets: ['localhost:9090']
# 采集node exporter监控数据
- job_name: '123.56.222.108' # 这里jobname是自定义的
static_configs:
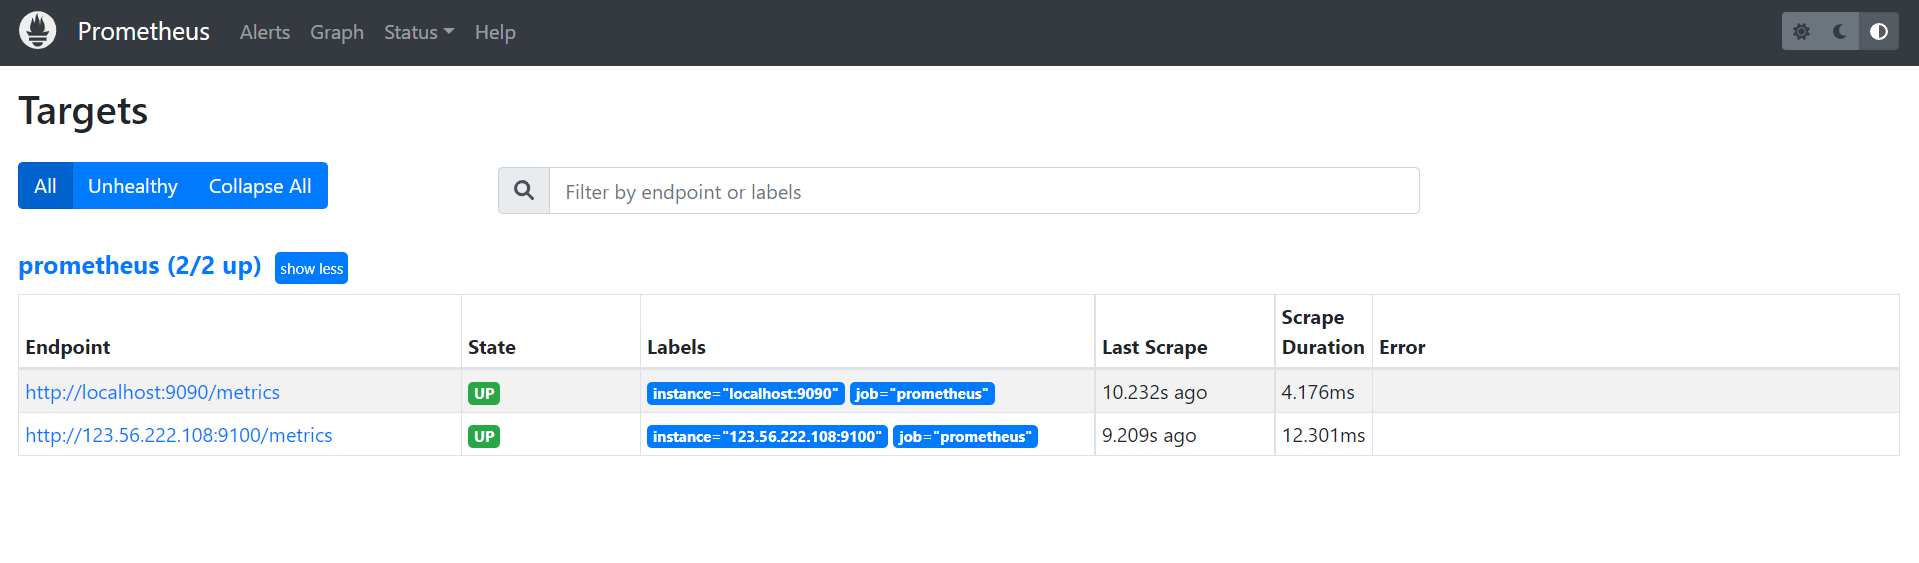
- targets: ['123.56.222.108:9100']重新启动 Prometheus Server,如果 Prometheus 能够正常从 Node Exporter 获取数据,则会看到以下结果:
up{instance="123.56.222.108:9100", job="123.56.222.108:9100"}    1
up{instance="localhost:9090", job="prometheus"}       1
其中“1”表示正常,“0”则为异常。
自动重启#
添加 node_exporter.service
vim /etc/systemd/system/node_exporter.service内容如下:
[Unit]
Description=node_exporter Monitoring System
Documentation=node_exporter Monitoring System

[Service]
ExecStart=/projects/node_exporter/node_exporter-1.3.1.linux-amd64/node_exporter --web.listen-address=:6060  # 这里ExecStart地址为node_exporter安装地址

[Install]
WantedBy=multi-user.target
设置自动重启
systemctl daemon-reload
systemctl start node_exporter.service
systemctl status node_exporter.service
systemctl enable node_exporter.service
Cadvisor Exporter#
安装镜像
docker pull google/cadvisor:latest运行容器
docker run \
  --volume=/:/rootfs:ro \
  --volume=/var/run:/var/run:rw \
  --volume=/sys:/sys:ro \
  --volume=/var/lib/docker/:/var/lib/docker:ro \
  --volume=/dev/disk/:/dev/disk:ro \
  --publish=8080:8080 \
  --detach=true \
  --name=cadvisor \
  --privileged=true \
  google/cadvisor:latest
开放端口
firewall-cmd --add-port=8080/tcp --permanent
firewall-cmd --reload任务和实例#
上面通过在 prometheus.yml 配置文件中,添加如下配置让 Prometheus 可以从 Node Exporter 暴露的服务中获取监控指标数据。
  - job_name: '123.56.222.108'
    static_configs:
      - targets: ['123.56.222.108:9100']
当需要采集不同的监控指标(例如:主机、MySQL、Nginx)时,只需要运行相应的监控采集程序,并且让 Prometheus Server 知道这些 Exporter 实例的访问地址。在 Prometheus 中,每一个暴露监控样本数据的HTTP服务称为一个实例。例如在当前主机上运行的 Node Exporter 可以被称为一个实例( Instance )。
而一组用于相同采集目的的实例,或者同一个采集进程的多个副本则通过一个一个任务(Job)进行管理。
* job: node
    * instance 2: 1.2.3.4:9100
    * instance 4: 5.6.7.8:9100
当前在每一个 Job 中主要使用了静态配置( static_configs )的方式定义监控目标。除了静态配置每一个Job的采集Instance地址以外,Prometheus 还支持与 DNS、Consul、E2C、Kubernetes 等进行集成实现自动发现Instance实例,并从这些 Instance上获取监控数据。
除了通过使用“up”表达式查询当前所有Instance的状态以外,还可以通过Prometheus UI中的Targets页面查看当前所有的监控采集任务,以及各个任务下所有实例的状态:
所以这里配置文件 scrape_configs 内容可以调整为:
scrape_configs:
  # The job name is added as a label `job=<job_name>` to any timeseries scraped from this config.
  - job_name: 'prometheus'

    # metrics_path defaults to '/metrics'
    # scheme defaults to 'http'.

    static_configs:
    - targets: ['localhost:9090','123.56.222.108:9100']